Trading: Technical Analysis Masterclass: Master the financial markets
Learn how to read charts, use indicators, and recognize key patterns — all explained visually and simply.
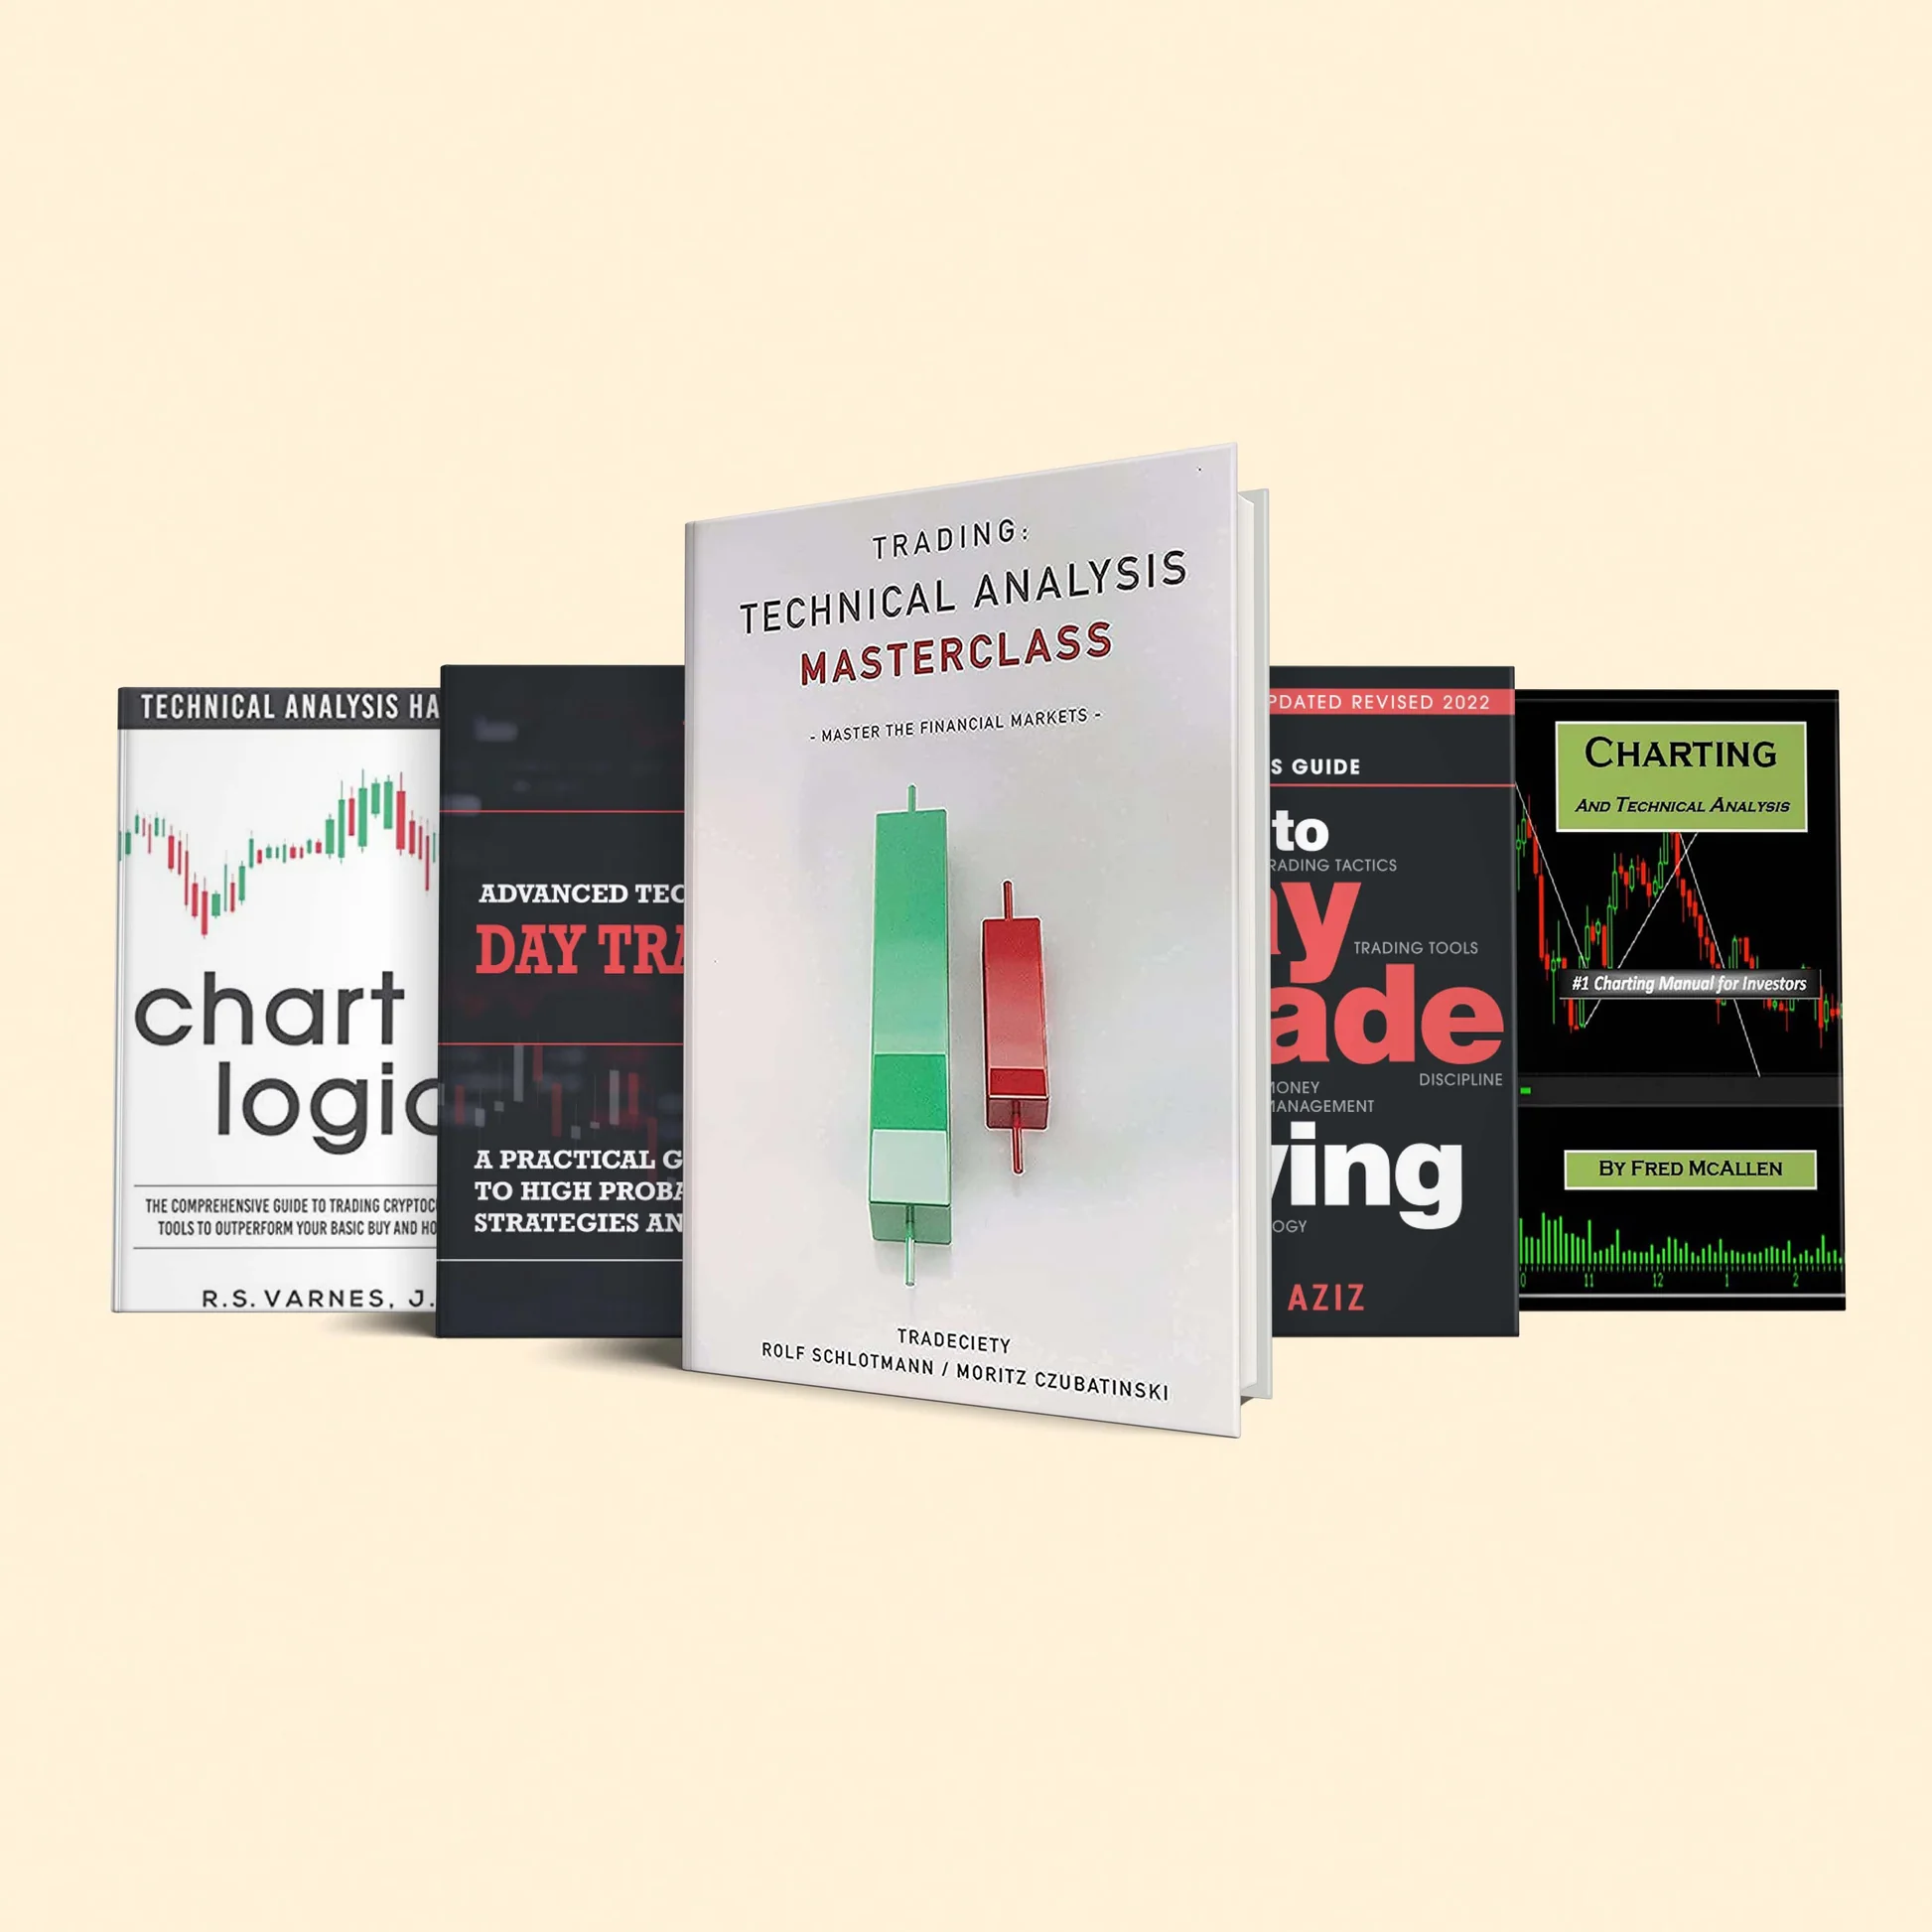
Learn how to read charts, use indicators, and recognize key patterns — all explained visually and simply.
Praise
Great explanations. I finally understand charts.
Alex Kim
Indicators are demystified.
Priya Sen
Patterns made simple.
Luis Diaz
Best book ever. I recommend it to everyone.
Emily Chu
Easy to follow. Perfect for new traders.
Ben Carter
Clear and concise. A must-read.
Mia Lee
Skills

Expert Charting Techniques
Advanced Indicator Usage
Pattern Recognition Mastery
Financial Acumen Growth
Team
Analyst
Expert in market analysis.

Mentor
Passionate about finance.

Trader
Seasoned trading strategist.

Coach
Dedicated to market education.

Guide
Committed to your success.

Bullet Points:
How to recognize market trends and reversals
How to use RSI, MACD, and Moving Averages effectively
How to spot classic chart patterns like head and shoulders or double tops
How to analyze markets across multiple timeframes for stronger insights
About
Book highlights.
/ 01
Solid charting information.
/ 02
How to use RSI, MACD, and Moving Averages effectively
/ 03
This book simplifies complex ideas into clear, visual steps — perfect for anyone starting their journey into technical analysis.

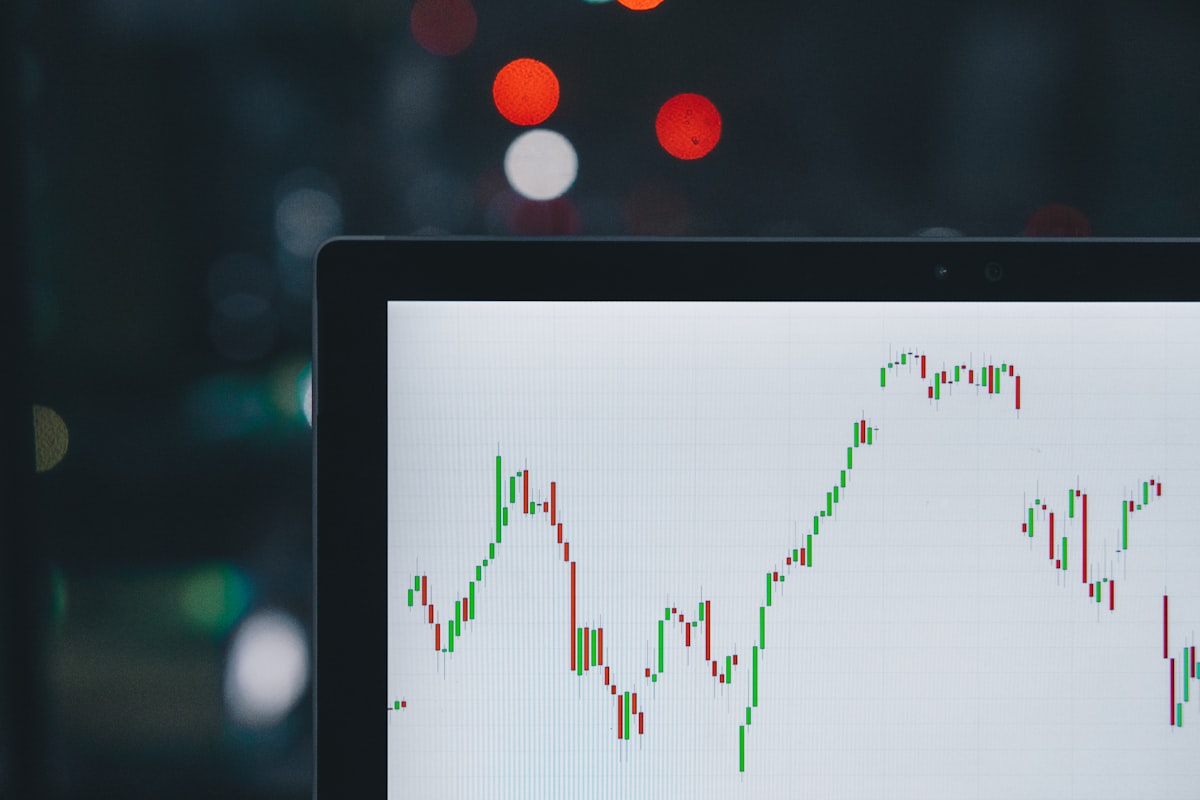
Technical Analysis Masterclass: Master the Financial Markets is a complete guide to understanding price behavior through technical methods.
It covers the foundations of trend analysis, pattern recognition, and the effective use of indicators like RSI, MACD, and Moving Averages.
This book simplifies complex ideas into clear, visual steps — perfect for anyone starting their journey into technical analysis.
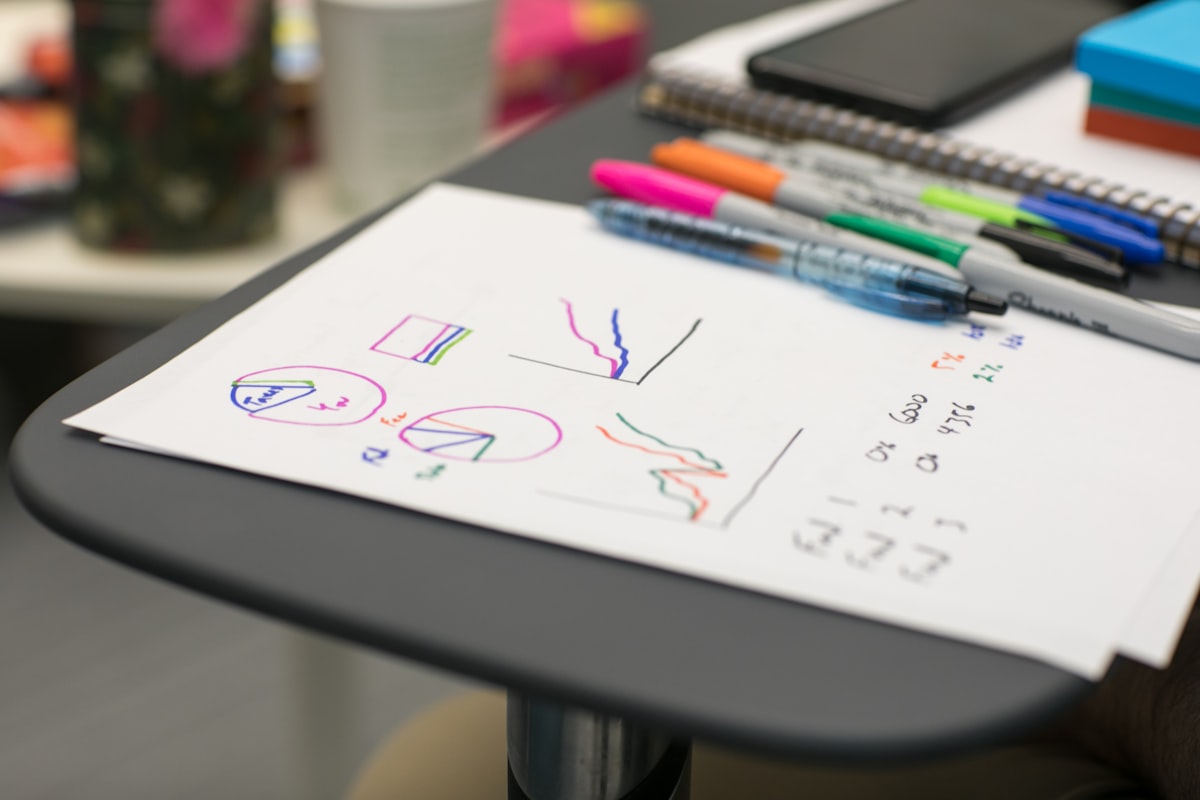
Learn
Understand trends, support, resistance, and price structure.
Develop the habit of viewing the market through probabilities, not certainties.
Identify breakout setups, reversal signals, and continuation formations.
Book
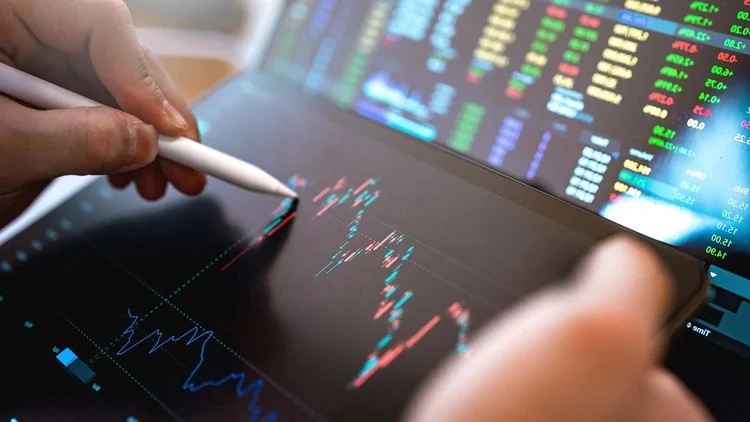
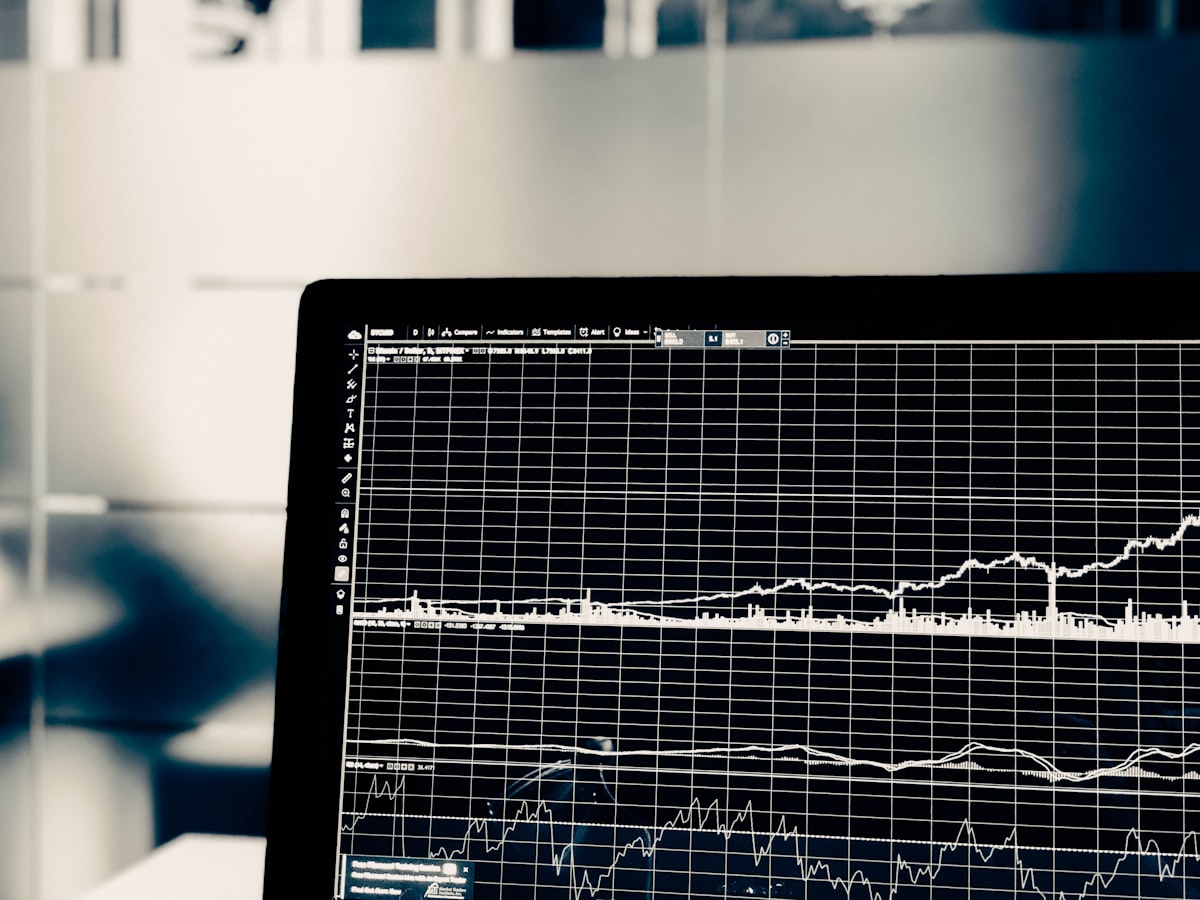
Learning to see the story behind each price movement is crucial.
Through real-world examples and annotated charts, you will:
Your path to mastery charting.
Spot divergences between price and indicators
Understand breakout and retest behavior
Recognize healthy and unhealthy trends
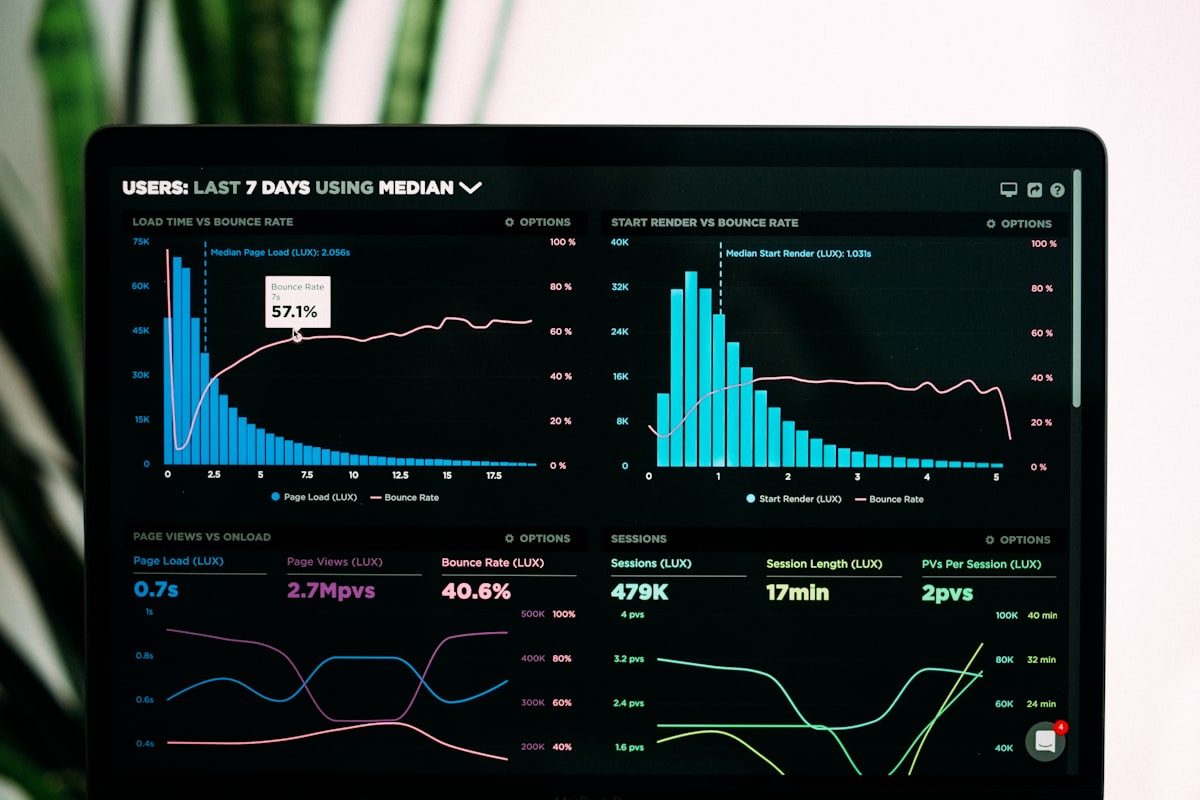
See how volume and price interact
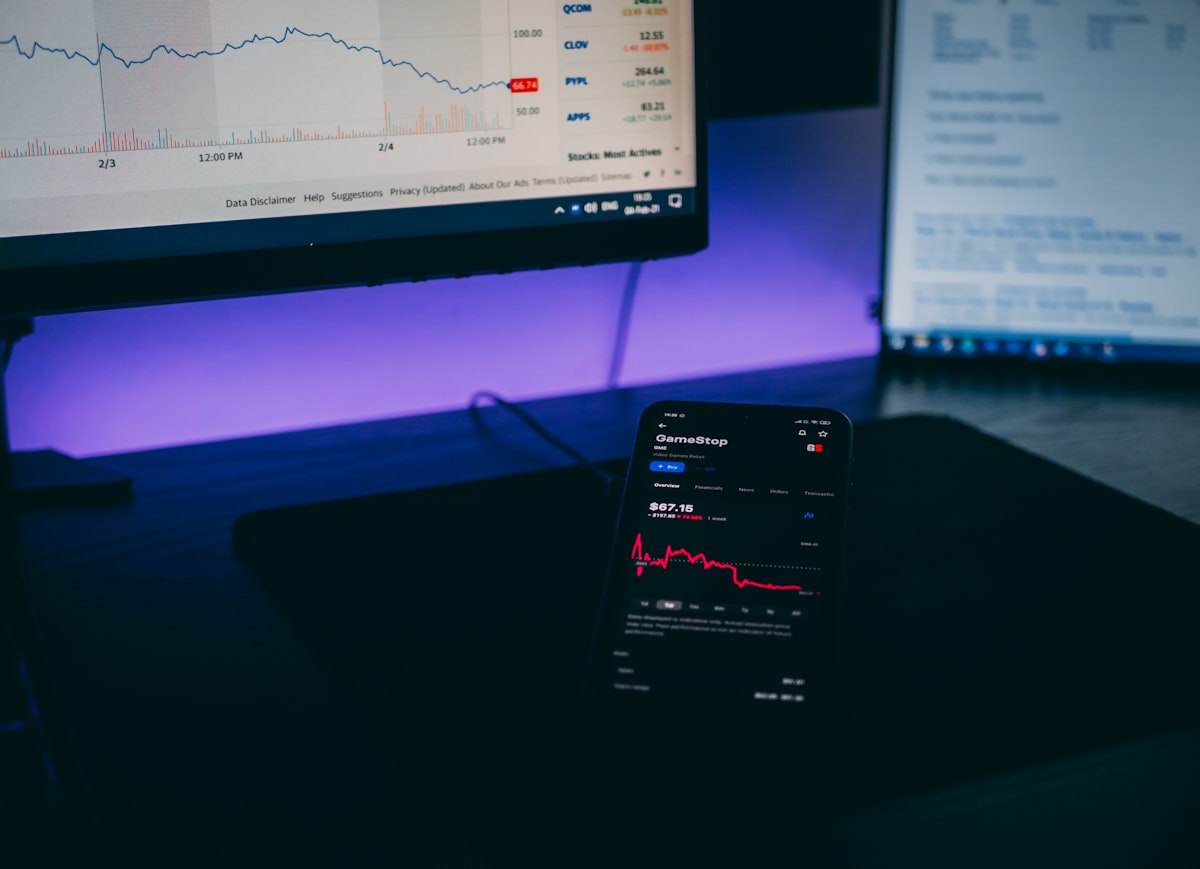
Caption Examples:
"Price breaking key resistance with volume confirmation"
"Divergence between MACD and price leading to trend reversal"
"Support retest visualized after breakout"
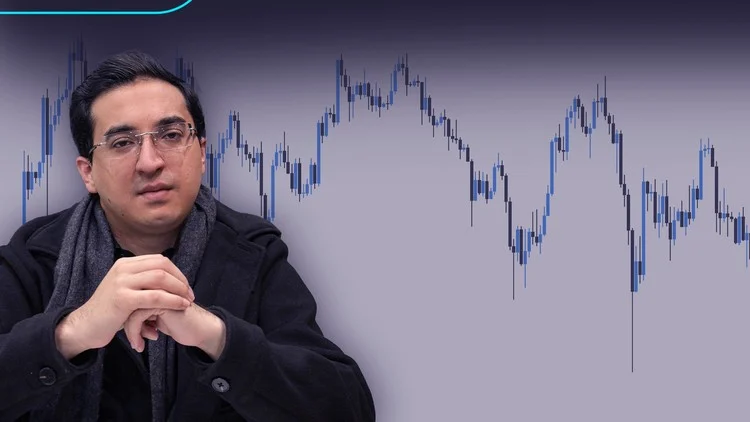
About
Technical analysis is not just about lines and numbers — it's about reading the story the market tells.
Through the Technical Analysis Masterclass, you’ll learn to decode price behavior visually, using proven methods that apply to any market or timeframe.
Whether you're trading, analyzing, or simply learning — strong visual skills will always give you an advantage.
FAQ

Yes. The Technical Analysis Masterclass starts from the basics of price action and trend structure, making it ideal for those who have no prior background in chart analysis.
No. While key indicators are explained, the book also focuses heavily on chart patterns, market psychology, multi-timeframe analysis, and building a full technical framework.
Absolutely. The principles of technical analysis are universal and can be applied to stocks, forex, cryptocurrencies, commodities, and more.
No. The concepts are platform-neutral. Examples are explained using visual charts, and you can apply them on any standard charting platform like TradingView or MetaTrader.
Yes. Rather than offering one rigid system, the Masterclass gives you the skills and tools to build and customize a strategy that fits your personal trading or analysis style.